
It's not rocket fuel
More data from HMRC Real Time Information further undermines the idea that migration is 'rocket fuel for economic growth'

I’ve written before about the vast variations in how people in different places experience migration. Even just the scale is really different, never mind anything else:
But as you will have spotted, the map above only goes up to 2021, because it is based on Census data.
If we want to analyse the local impact of the extraordinary immigration of recent years we need some other data.
Once upon a time we could have used the Labour Force Survey, but, as I have written before, it has collapsed, and is particularly unreliable for looking at migration, (as the ONS themselves point out).
The one other possibility for more up to date data would be the HMRC Real Time Information data. It can’t tell us about the total number of migrants arriving into each place, but can tell us about the number of people in formal employment (though not self-employment).
HMRC publish monthly data on the number of jobs in each local authority and also publish data on employments in the UK by nationality1.
I have asked for local authority data by nationality. So far, HMRC are refusing my FOI request for this, even though they do publish the same thing at a regional level, so they can clearly do it. I am currently appealing this decision to withhold the info. But in the meantime, the regional level is as good as it gets. What does this regional data show us?
Immigration by region
Here’s how the share of employments held by non-UK nationals has increased over time. The change has been much faster since 2021. The trends are different between regions.
First, here it is with London included - the share in the capital is much higher.
To make it a bit easier to see, here it is without London:
It is probably easier to spot the differences in the trends if we look at the rate for each region, minus the rate for the UK as a whole. This lets us more easily see that growth in non-UK nationals as a share of employments has been lower than average in the South West, Scotland, Wales and Northern Ireland, and higher than average in the West Midlands. (London isn’t shown here - it’s way above the national average).
The HMRC data allows us to look at EU and non-EU migration separately. Migration from outside Europe has driven the growth since 2021. The change is fast. For the West Midlands the share of employments from people from outside the EU rose from 6.5% to 11% in three years, for Northern Ireland from 2% to 4.2% and so on.
ONS no longer publish population by nationality. We could use this to work back from this data on employments to fill that hole and make guesses about how many people are here in total, in different placeds - including those not in employment?
This can only be a back-of-envelope excercise for two reasons.
First, from the last census we could see that working age people who were born in the UK had a higher rate of employment than people who were born overseas. But there was massive variation - generally people from the EU, anglosphere and other developed countries had higher employment rates. We know the balance of nationalities has really shifted since 2021.
Second, employment rates may well have changed since 2021. That seems more likely than non. Indeed, HMRC produced one ad hoc publication trying to work out how many employees there were, as well as how many employments (because you can have more than one job). Even there the ratios were on the move, never mind employment rates. The ratio for EU nationals was higher than the national average, while the ratio of employments to employees was lower for non-EU migrants. And it had started to trend downward during 2022 as numbers took off:
So the following analysis comes with a massive pinch of salt. But if we work out what percentage share of the total UK-wide increase in employment of non-UK nationals each region has had since 2021, we could use that to divide up net migration by region. For this to be accurate, we would have to assume that migrants were homogenous, and the mix and their employment rates were the same in different regions (which is unlikely).
Still, there are some pretty clear trends in the recent data. Since 2014 London has gone from having 39.2% of all non-UK employments to 32.3% by the end of 2023 - the rest of the country has seen them rise faster. London ‘only’ saw 25% of the increase over the period 2021-2023.
If we apply each region’s share of the growth in non-UK employments to the total amounts of gross and net migration over the same three years, here’s what we get, for what it’s worth.
The above is for the change, not the stock - I’m not going to even try and read across from the RTI employments data to shares of the population. Comparing the Census data on the share of the population born abroad to the data on non-UK employments for the same time shows (obviously) a strong correlation, but also quite a big scatter. For example, in 2021 the South East and West Midlands has similar shares of the population born abroad (15.2% vs 15.8%), but the share of employments held by non-UK people was not far off twice as high in the South East (7.6% vs 14.6%) - differences which will reflect some combination of factors like commuting, age and other demographics.
What about growth?
Has this large increase in the share of people from overseas proved to be the rocket fuel for growth that some claim it is?
Let’s compare the growth in the share of workers from overseas over time to the growth in productivity, as measured by pay.
If immigration is rocket fuel for growth we will see the dots form a nice upward sloping line here, because the more migration, the faster the productivity growth, right?
Oh.
There’s no very obvious trend here. What if we just look at the very rapid growth in recent years - perhaps that will make an effect clearer because the pace is faster, and the ratio of signal to noise will be better?
Still nope. No clear link between productivity growth and migration.
What if we flip to a different measure and use mean rather than median pay? Still no:
We are often told that very high rates of immigration are needed because this will be great for growth. This is just one more data point suggesting that it isn’t.
If we look over time, rather than between regions, there is also no good reason to think migration is rocket fuel for growth:
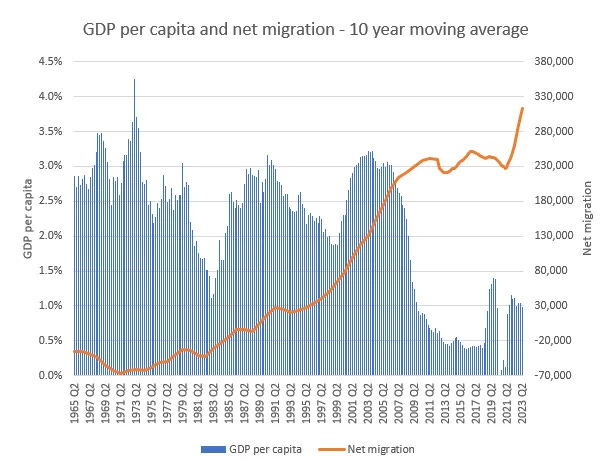
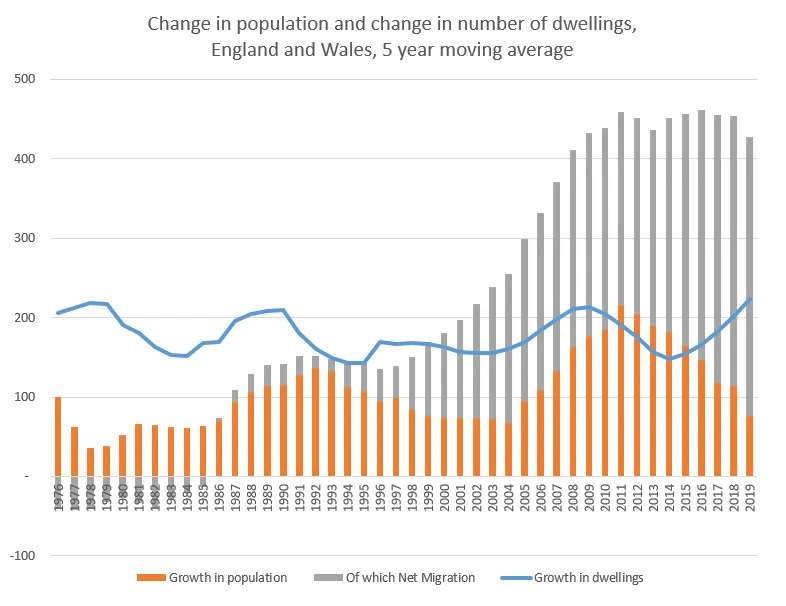
And you may have seen in my previous posts examples of some of the wider economic challenges it throws up - for example, changing the housing challenge from a difficult one, to an almost impossible one.
I was reminded of this chart below when the ONS produced a forecast the other day showing all population growth in future is coming from immigration.
Conclusion
There is a lot sloppy thinking around this issue.
Many people just make random assumptions that immigration is great for the economy. Others get stuck at the stage of thinking: more people = more GDP = A Good Thing, rather than even thinking about GDP per capita or productivity. Analysis in so far as it exists, tends to focus on just one narrow aspect of one element of the story - are migrants as a whole (as if they are one bloc) net taxpayers?
We need to think more about the wider economic effects on the capital stock and housing. And there are a bunch of considerations about quality of life - considerations that are more than just economic - which should also guide policy in a more cautious and selective direction. We also need to think about what kind of migration we want: I wrote before about the case for more selectivity.
You don’t have to be a migration sceptic to think that the current (and forecast) pace of migration is way too high. As Kemi Badenoch has said: “Our country cannot sustain the numbers we have seen. We are reducing the quality of life for people already here.”
As a recent SMF report noted: “The ONS anticipates that net migration into the UK will be about the same in 2030-2039 as it was for the entire cumulative period from 1940-2009".
The ONS forecast the same for the decade after that too, so on current ONS forecasts we will be packing 140 years worth of historical change into just two decades.
Yet when I look at the data above, I can’t see a very good reason for us doing this.
Thanks for research. I don’t think looking at pay is best metric to determine how immigration benefits an economy. Immigration at low salary level depresses prices for goods and services and probably depresses wages. That’s good for consumers - more choice, better prices so your salary goes further and your standard of living improves. Not so good for low wage uk workers having to compete and not so good for everyone with extra burden on public services.
Also the period you look at is affected by Brexit which it seems has depressed uk’s economy by making import and export of goods from our closest neighbours much more difficult and costly.
Superb thank you. Would you be able to produce a shorter version possibly only 2 sides of A4 with the most important points? Best wishes