
New data shows the number of really large welfare claims is even higher than thought

A while back I wrote about the growth of really large benefit claims and made a welfare atlas of Britain.
I did warn that some of the data was about to change - and it has.
The Family Resources Survey (FRS) is kind of a big deal in government statistics. They ask a load of people very detailed questions about exactly how much money they have coming in from earnings, investments, benefits and so on. It is used to calculate many things - like measurements of relative poverty and the “distributional analysis” you see alongside the Budget, and so on.
The nice thing is that it links together information from many sources; income from work, every type of investment, every type of benefit, together with info on the household: whether they are carers or disabled, what sort of household it is and so on.
But for many years people have noted that when you add it all up, the amount people report receiving in benefits is smaller than the actual total the government is spending. People forget what they have received.
So the DWP have now started supplementing the survey data with some administrative data - they link up people’s survey replies to administrative records.
This is a work in progress. So far they have only thoroughly revised the data for the years after 2021/22, thought there are some changes to earlier years too.
The effect has been to halve, but not fully close, the gap between the money sent out and the income reported. According to DWP:
“At a United Kingdom level, the average survey undercount over the three years to 2024 is 18%, while the admin-linked percentage is 9%”
The gaps are different for different places and benefits. For example, under-reporting was particularly high in Northern Ireland. And some benefits are more under-reported than others:
More large claims
One thing that the new data does is shed new light on the phenomenon of really large welfare claims. DWP refuse to use their administrative data to answer questions about how many households are making large benefit claims, so the data from FRS is the best tool we have to look at this. Though a chunk of benefit spending is still missing, we can now get a more realistic sense of how many households are making really large welfare claims and the numbers are larger than previously reported.
The average full time worker earns about £39,800 a year, which is £32,200 after tax.
There are many working age households getting more than this in benefits. There are now:
819,000 households getting over £30,000 a year in benefits,
626,000 getting over £32,200 (so more than the average take home)
267,000 getting over £40,000,
91,000 getting over £50,000,
16,000 getting over £60,000.
The (revised) number getting over £30,000 in real terms is up by 7% since 2021/22 - and is up by a third compared to the figures before they were revised.
What do we know about these households?
In terms of where they are, a greater proportion of working age households have large claims in London and the North East, and lower in the Midlands, Wales and the East of England.
In terms of ethnicity, some groups are more likely to see large claims than others. Indian households of working age were the least likely to have large claims while Pakistani, Arab and Bangladeshi households were more likely - one in eight Bangladeshi households of working age claim over £30,000 in benefits, compared to less than one in 25 nationally.
The proportion of households making large claims is much higher among those in social housing - again, over one in eight. The big difference with private renters is slightly surprising - after all, households in social housing are already benefitting from a rent subsidy. The value of that non-cash subsidy is not captured in this data and in fact it should reduce any housing benefit income, which is measured here.
If we were to include the implicit value of their social housing the sums these households are receiving from taxpayers would be even larger.
Conclusion
I wrote before that the real-terms growth and scale of really large benefit claims from working age households makes the case for a return to welfare reform stronger. We need reforms across all types of benefit - and particularly the Household Benefit Cap, which is no longer really constraining the growth of really large claims. Over the weekend Kemi Badenoch and Helen Whately have been setting out our plans to fix this.
A significant number of households are getting a lot more in benefits than the average person gets to take home after working full time. We need a system that’s fair to taxpayers as well as those benefitting from it.
Postscript: some other consequences of the changes to the FRS
So far DWP have only updated the years since 2021. So a lot of the statistical series that flow from it now have a break in the series.
Labour’s preferred measure of relative child poverty is affected by this:
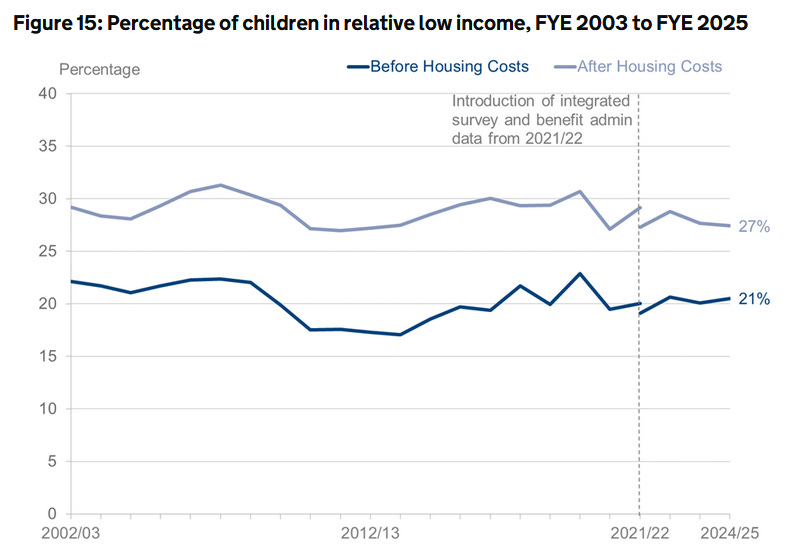
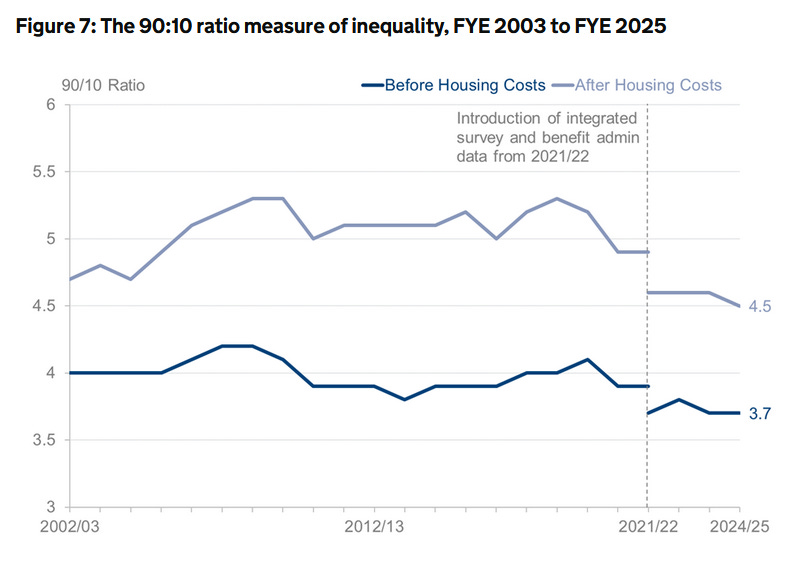
In some cases the break in the series is really massive, like the 90/10 ratio:
There are similar-ish data sets that won’t have this problem. We know from a different set of ONS statistics (which don’t have the same series break) that overall income inequality fell under the last Conservative government. Having increased from 33% in 1997 the Gini coefficient rose to 39% in 2008, and 37% in 2010, but had fallen back to 33% by 2024:
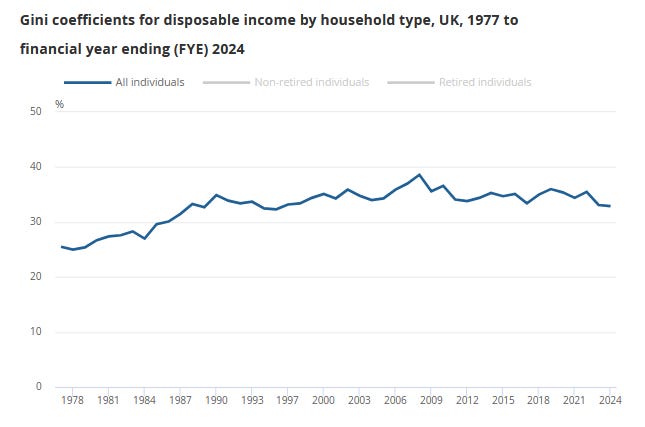
But these other statistics don’t have the same details as those from DWP’s Family Resources Survey, so quite a lot of comparisons will have to be restricted to the short term - until and unless the figures are revised back further.
We've just seen this morning reports that very large numbers of people are at risk of food insecurity and that there are people turning up at food banks who are tearing open their boxes as soon as they receive them. THAT's how far you've pushed things already.
But all Neil O'Brien can do is start the usual Tory trick of benefits bashing because all that party has left now is turning people against one another so as to deflect attention away from the psychopathically greedy and selfish.
Quite obviously very large numbers of people are going to starve to death in this country and social chaos is going to ensue. You can't ever say you weren't warned.
I'm truly amazed that at this stage in the game you're stupid enough to keep doing this and to proudly put your name to it.
If I were you I'd be thinking about what you're going to do after you've stopped being an MP.
It should be possible to model the % receiving >£30k when taking into account the implied subsidy of social housing. Even taking a conservative assumption of £10k subsidy for living in Somers Town and Tower Hamlets, that would surely boost many over the £30k mark.
If you have code, could you share it please? I would like to work this out myself.