
Welfare reform and the Household Benefit Cap
We need to restart welfare reform

In Britain the amount a family can claim in benefits is supposed to be capped. But nearly two million families claim more than that cap. How come?
The Household Benefit Cap was introduced in 2013. It was one of a suite of measures taken by the last Conservative government to rein in welfare spending. The idea is that benefit claimants who could be working should not be able to get more in benefits than someone similar can earn by working.
But, because the cap was quite a controversial idea at the time, the idea of “someone who could be working” is baked into the design of the cap in a very generous way.
First, the household is exempted from the cap if someone in the household gets one of 16 exempting benefits. (I have put the list at the bottom). So, for example, if your child gets DLA, or your partner gets PIP, then the whole family is exempt from the cap. (A different design would have been to exclude those benefits from the calculation, rather than triggering a blanket exemption).
Second, if you have been in work for more than 12 months there is a “grace period” of 9 months before the cap kicks in.
Third, You are exempt if the family (in total) earns £722 a month (£8,664 a year) or someone in it works more than 16 hours.
As of the middle of last year, just under 120,000 households have their benefits capped. But how many are exempted from the cap?
Sadly, on that question - and all other aspects of the cap - the government is refusing to answer our Parliamentary questions:
How many people get more than the cap? The government won’t say.
How many people are exempted from the cap as a result of each exemption? The government won’t say.
How many people are exempted from the cap because they earn enough? The government won’t say.
How many people leave the benefit cap for different reasons? The government won’t say.
How many people are in the grace period? The government won’t say.
How many people will become subject to the Household Benefit Cap following the removal of the two-child limit? The government won’t say.
You get the general idea. They are being distinctly non-forthcoming.
Obviously they have the data, but they claim it is “too expensive” to work it out.
The government does publish the numbers flowing on and off the cap. But they do not provide a meaningful breakdown of these flows, never mind the levels.
All we can see is that just 8% of people who did flow off the cap in the first half of 2025 did so because their earnings rose to exempt them. Whether the other 92% leavers started claiming fewer benefits or (I suspect) got themselves onto an exempting benefit we cannot say from the published data - and when asked, the government is… (you guessed it) refusing to answer.
So... how many households are claiming more than the cap?
In the face of the government’s stonewalling, we are forced into some vigilante statistical analysis.
If we use the published data from the long-running Family Resources Survey (FRS) we can look at the total amount of benefits claimed by non-pensioner families, and compare that to the cap level for that kind of family.
Crucially the word “family” has a special meaning in DWP stats - the technical term they use is “benefit units”. That’s because a “household” can contain “multiple benefit units”, whereas a benefit unit is the specific group of people (claimant, partner, and dependent children) whose income and circumstances are assessed together for a single benefit claim. If grandparents live with a nuclear family, they will likely be in a different “benefit unit”.
If we look at all state support, then there are 1.9 million non-pensioner benefit units getting more than the benefit cap for that household type.
This is not the same as the number who are currently using one of the exemptions to the cap as currently designed - as it is not even supposed to cover some of these benefits. Still, this gives some sense of the number of families getting larger benefit payments.
While an overestimate in one way, it is an underestimate in another - the Family Resources Survey is known to undercount benefit receipts as people forget what they have had. Just under a fifth of actual spending doesn’t show up in the FRS.1
So how much are the exemptions costing taxpayers?
The government does publish how much the cap reduces the incomes of those currently affected, and with 124,000 households having their benefits reduced by a mean average of £256 a month that implies that in a static sense (even ignoring incentive effects) the current cap is saving taxpayers about £380m a year.
A policy that would bring the much wider number of families claiming larger amounts into scope would potentially save a lot more.
Households
Now let’s flip and look at “households” in the normal meaning of the word. Particularly where people have extended families, there can be several “benefit units” in a household.
The chart below is in real terms - but as you can see, even after you strip out the impact of inflation, the number of working age2 households getting large sums is going up.
The number of big claims rose in the Blair years, stabilised after the introduction of the benefit cap and other reforms, but has started to increase again more recently.
The FRS data is quite laggy - but I suspect that we will see that rising trend is (at the very least) continuing. It is more likely to increase as the impact of things like the end of the two child cap and other measures kick in.
Those exempting benefits - particularly sickness and disability benefits - have seen large increases in the numbers claiming, and these increases are forecast to accelerate.
For example, the numbers on DLA/PIP rose from 3.2m in 2010/11 to 4.4m in 2023/4, the last year of the chart above. But more to the point DWP forecast numbers to 6.7m by 2030/31, which will continue to erode the scope of the Household Benefit Cap.
The current setup and exemptions strongly incentivise people to get onto one of the exempting benefits.
I am very struck that where people are particularly likely to have large claims (expensive central London) we see that a greater share of UC claimants are claiming the health element. This is striking because in general London has a smaller share of UC claimants on the health element (because the population is much younger). You can see that as the dark blue blob in the middle of London below. This seeming anomaly may be a reaction to the household benefit cap.

You think this is too cynical? I’m afraid people always learn to work the system and how to answer questions to claim successfully - indeed for a small fee there are various websites that will tell you how to do this.
That, in combination with a relentless series of legal challenges by activist groups tend over time to weaken controls on spending.
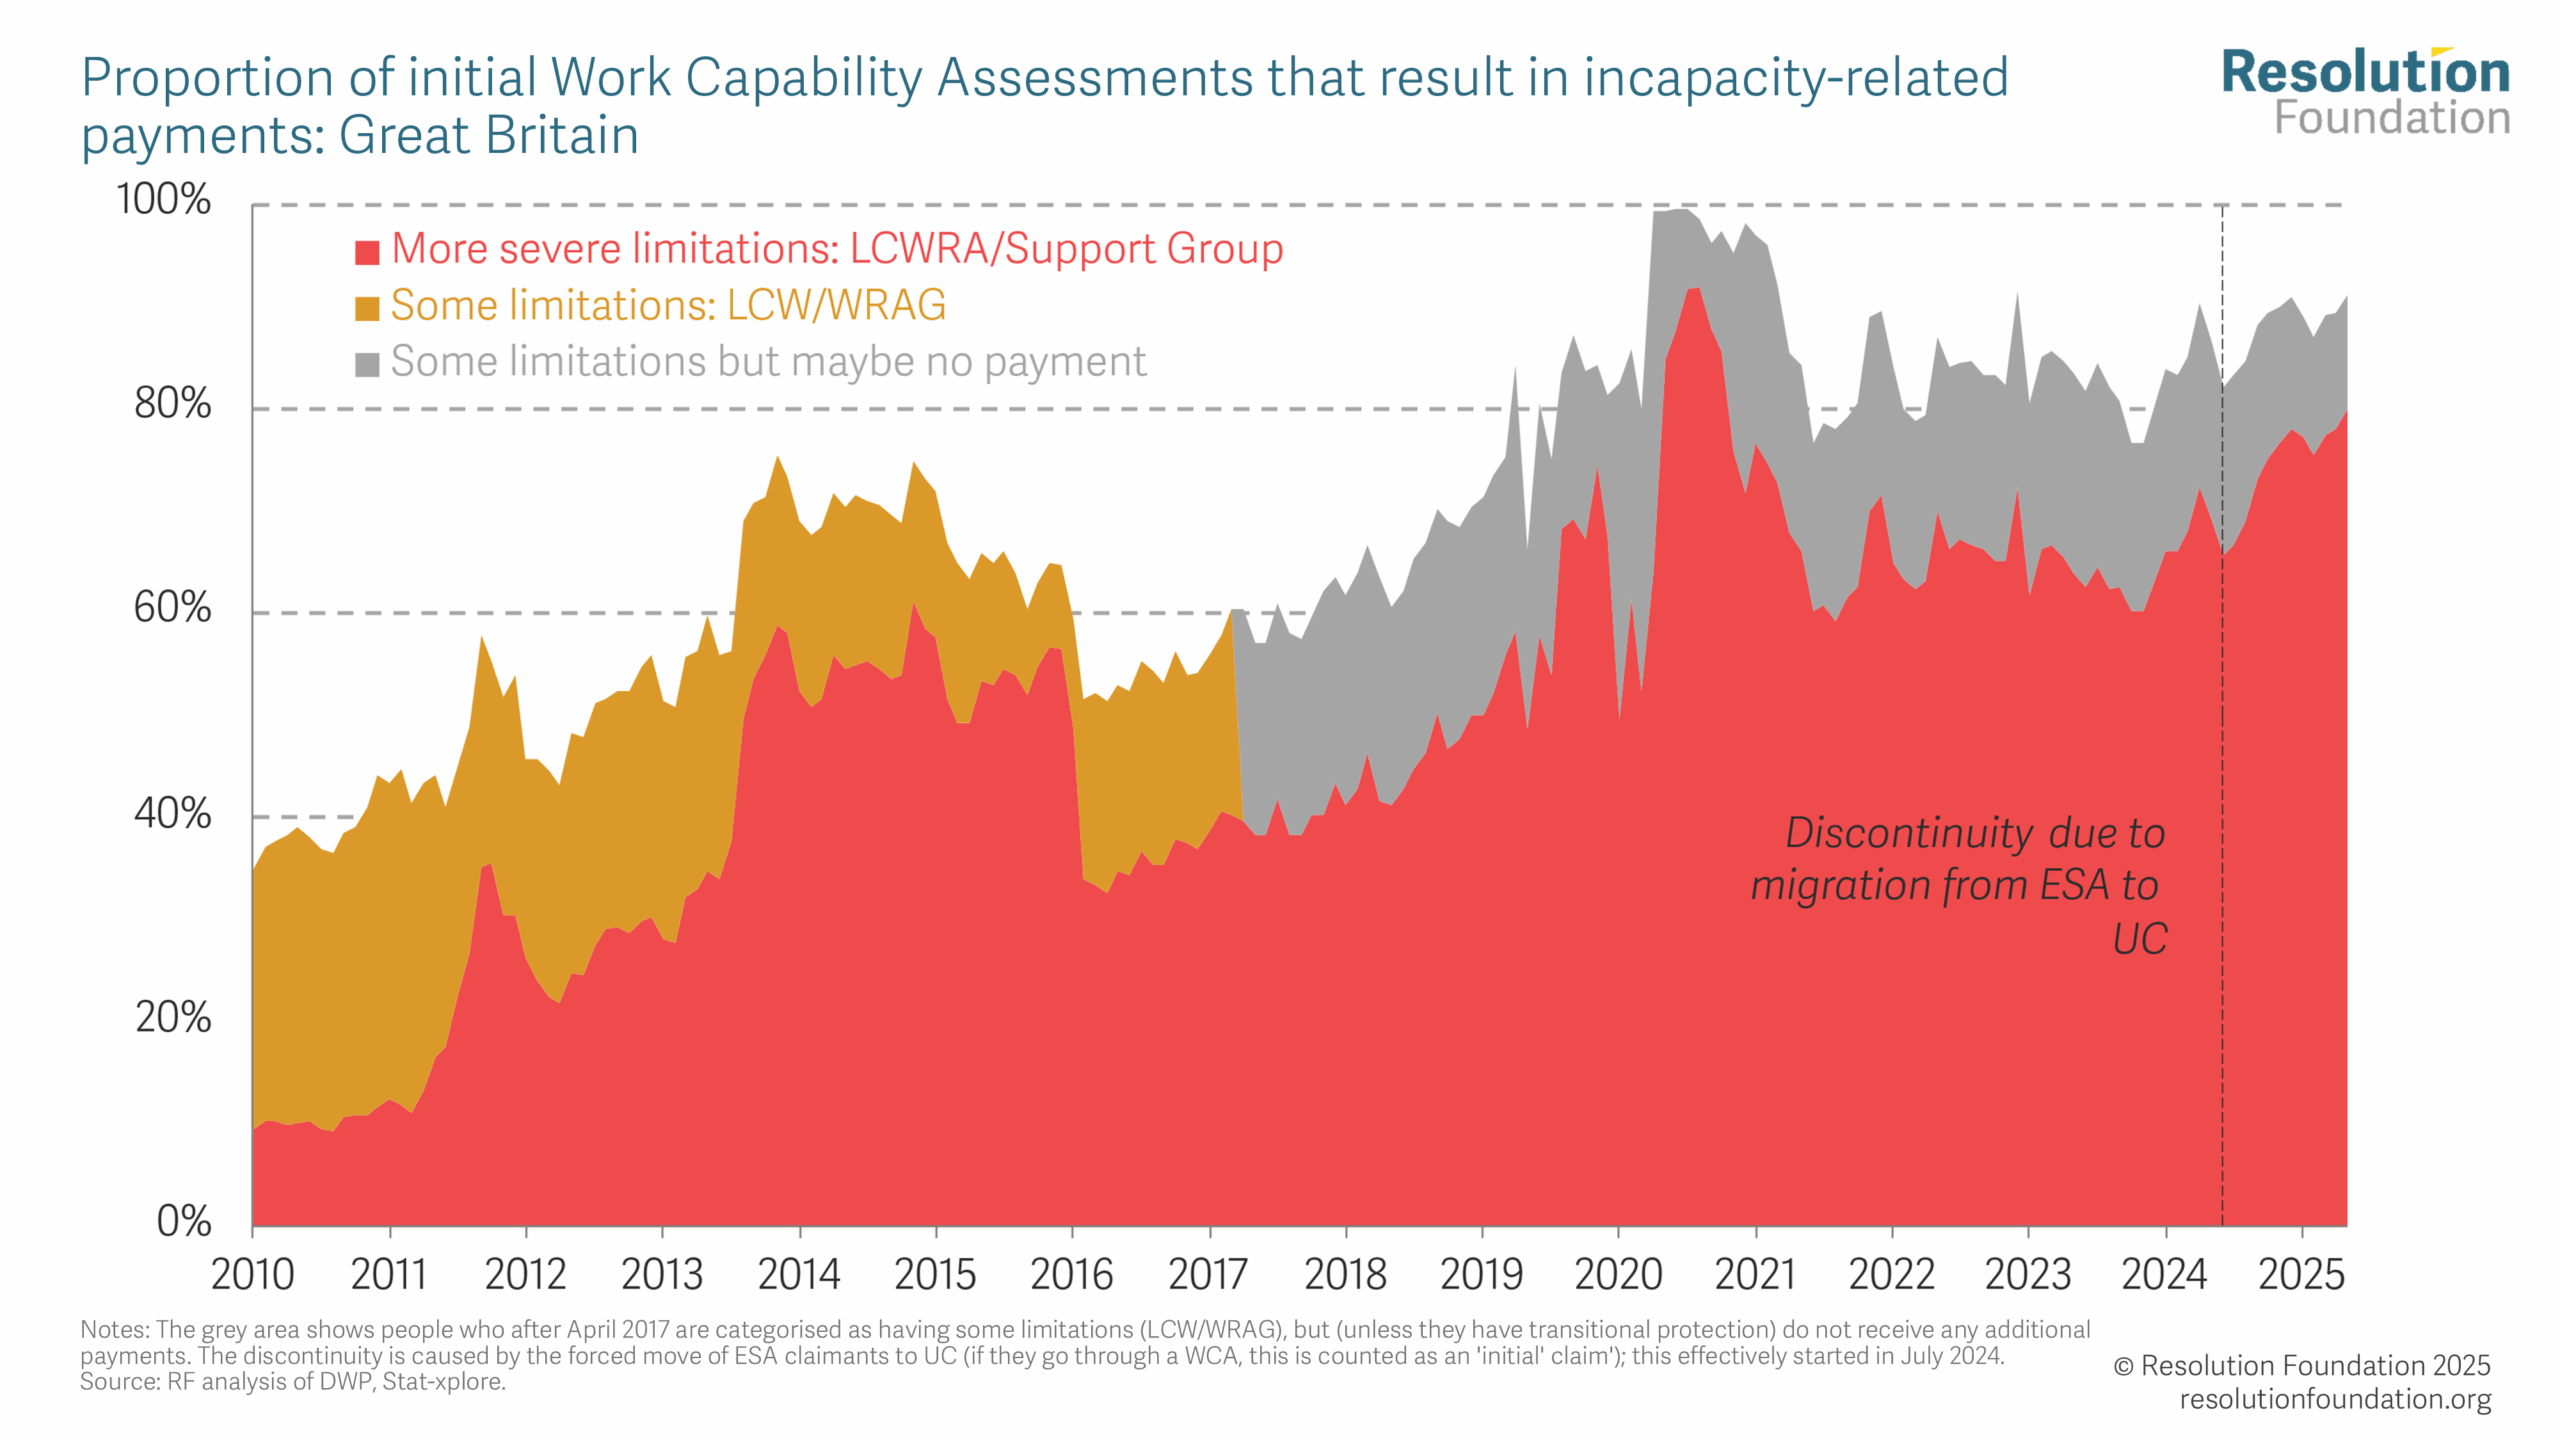
The history of incapacity benefits is a good example of this tendency. Over the last 15 years we have gone from less than 10% being put into the highest payment category to 80% getting it - shown in dark orange below:
Conclusion - we need to restart welfare reform
Is welfare reform impossible? No - under the last Conservative government we did control spending, and up to the pandemic spending on working age welfare fell in real terms - the only sustained period in which this has been true in my lifetime. Welfare spending didn’t return to the level of 2012/13 until 2024/25.
But to do this we needed to reform on all fronts. We slowed benefit uprating, tightened caps on housing benefit spending, reformed incapacity benefits, extended conditionality, (including through Universal Credit, which asked non-working spouses of claimants to work for the first time), we cut the spare room subsidy, and introduced the two-child benefit cap. Under Starmer this is being dropped or eroded away, and so the bill is forecast to rise in real terms by nearly £20bn a year over this parliament - roughly as much as we spend on the police in England.
The Household Benefit Cap is only one part of the picture obviously. We need to fundamentally reform sickness and disability benefits - indeed last year Number 10 were making the case for this, but folded at the first sign of unrest from Labour MPs.
We must restart the process of welfare reform - we can’t afford not to. And that has to include the Household Benefit Cap.
Annex: The Exempting Benefits
You’re also not affected by the cap if you, your partner or any children under 18 living with you gets:
Adult Disability Payment (ADP)
Armed Forces Compensation Scheme
Armed Forces Independence Payment
Attendance Allowance
Carer’s Allowance
Carer Support Payment
Child Disability Payment
Disability Living Allowance (DLA)
Employment and Support Allowance (if you get the support component)
Guardian’s Allowance
Industrial Injuries Benefits (and equivalent payments as part of a War Disablement Pension or the Armed Forces Compensation Scheme)
Pension Age Disability Payment
Personal Independence Payment (PIP)
Scottish Adult Disability Living Allowance (SADLA)
War pensions
War Widow’s or War Widower’s Pension
Including pension benefits the FRS captured £191 billion of welfare payments in 2023. But we know from administrative data that the UK actually handed out £234 billion, so about 18% of spend is “lost”. This is going to be addressed in future years of the FRS.
There may of course be pensioners and pension income in households headed by working age people, but looking at households headed by a working age person strips out most pension income - Stat Xplore records total state support for households with working age heads in 2023/4 as £106bn while all households received £240 billion. The DWP outturn tables suggested £126bn of spending in Great Britain on people of working age and children and £287bn including pensioners - so the ratios are similar.
Excellent post - good data on how many households have large exempt claims.