

A while back I met up with some youngish graduates from a good university. They told me that about half their friends are on benefits and not in work. This blew my mind.
But the stats agree - it’s bad out there for young people - really bad. Let’s take a look.
At the start of the century about two thirds of all young men aged 16-24 were in work. It is now just half1.
Some of this reflects rising numbers in higher education. But even when we just look at those who are not in full time education, the share of young people who are either unemployed or inactive is close to historic levels (the green line below). In fact it is higher than in the early 1990s, (the Full Monty era, if you will), which at the time was widely considered to be disastrous.
This is driven by steadily and dramatically rising levels of inactivity – people who are not even seeking work, often because they are on benefits (shown in the red line below).
The long term deterioration is particularly pronounced for young men (orange below). From 1997-2004 only about 20% of young men who weren’t in education were not in work. Now it is 31%.
For me the really alarming thing is that we are seeing this outside a recession. We can see there were high rates of unemployment after the recession of the early 90s, and again after the 2009 recession (the blue line above). We aren’t in a recession right now but steadily and relentlessly the share of young people who are not in education but inactive has been going up and up. So my question is – what happens the next time there is a downturn?
And of course it is worse in some places. I asked the Commons Library to do some analysis of the underlying data. 40% of young people in London who are not in education are inactive or unemployed.
Across the UK there are 1,038,000 18-24 year olds who are not in education and not in or work, and 1,239,000 16-24 year olds - think about what we could do if we could move some of those people into work.
Worse than it looks?
But there are several things that mean the situation may be even worse than it appears in the data above, which is from the Labour Force Survey (LFS). The LFS is a classic workhorse survey the ONS produces to estimate employment and unemployment, but over recent years it has had some well-known problems which are still being ironed out. There is a lot of debate about this, but good reasons to think we should look at some other data sources2.
Lets look at benefits data. Disability benefits for young people have grown faster than the LFS survey’s count of young people inactive through sickness.
Between Labour taking office and July 2026 the number of 16-24 year olds claiming PIP increased by 79,000, or 21%
This is a continuation of a trend - since 2019 the growth of PIP claims has been particularly dramatic among young people:
The DWP’s own forecast is that benefits for young people will continue to grow faster than for adults. Between the Conservatives leaving office in 2023/4 and 2030/31) DWP forecast that:
Spending on incapacity benefits for working age people (mainly UC Health) will have increased from £25.3bn to £36.2bn (43%)
Spending on working age disability benefits (DLA and PIP) will have increased from £19.1bn to £37.2bn (95%)
Spending on DLA for children will have increased from £3.6bn to £8.3bn (128%)
What about nationality?
Another data source we can look at is HMRC Real Time Information (RTI)3. It contains information on what nationality adults held when they first got a national insurance number.
We can see from the RTI data that the number of jobs held by young British people has actually gone down in the last year - there were 61,000 fewer jobs held by young people from the UK in December 2025 compared to December 2024. This has been partially disguised by an increase among young people from outside the EU.
International comparisons
For the first time, youth unemployment in the UK is worse than the EU average4
Labour inherited a rate of youth unemployment below the eurozone, but it is now above. In July 2024 it was 13.8% in the UK and 15% in the euro area. As of June 2026 it was 16.4% in the UK and 15.2% in the eurozone5.
Youth unemployment among 20-24 year olds in London is higher than in Estonia, Croatia and Slovakia. Youth unemployment among 20-24 year olds where I am based in the East Midlands is worse than Lithuania, Slovenia and Bulgaria6
Conclusions
It is pretty bad out there for young people. While some of these problems have been building up for too long, Britain’s relative performance got a lot worse after Rachel Reeves became chancellor.
There is no mystery about why this is. The new Labour government decided to simultaneously:
Hugely increase the jobs tax, in a way focussed on lower earners - which therefore disproportionately hit young people…
…While also increasing business rates for the high street sectors most likely to employ young people.
Massively increase labour market regulation with the Employment Bill, which made it much less attractive to hire young people
Attempt to equalise the minimum wage for 18 year olds and 60 year olds for the first time - something rejected by Tony Blair and Gordon Brown (and which some people in government are now frantically trying to back away from)
You can see the impact of some of this in the way that smaller businesses have cut hiring more than others - for them the regulatory changes bite hardest because they don’t have the scale or HR departments to cope.
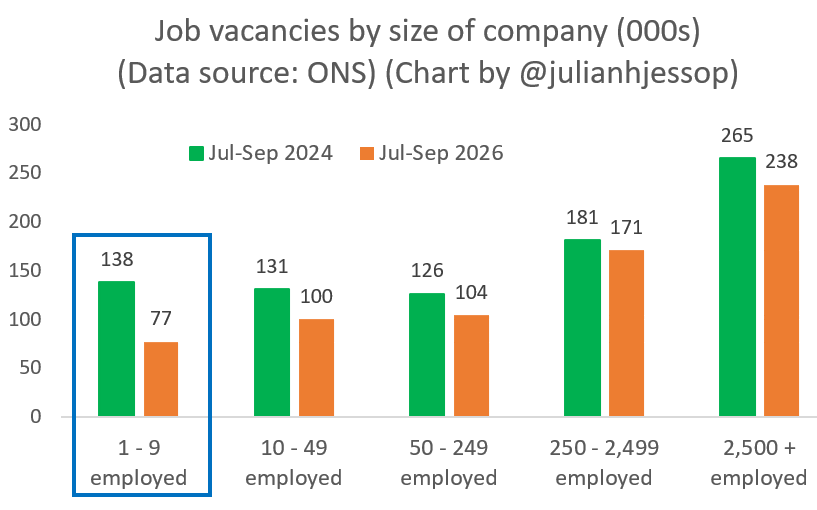
High rates of youth unemployment have bad longer term consequences for people’s later earnings and employment - something described as “scarring” by economists. So we need to get worklessness down urgently. The government’s Milburn Review has been pushed back but some pretty drastic moves are needed urgently.
On the Conservative side we have set out plans to:
Halve the jobs tax for people aged 21-24 (which builds on our previous decision in 2015 to abolish it for the under 21s.)
Set up “Get to work” - which will mean that young people who have not worked will no longer be able to drift straight from school into claiming benefits.
Create 100,000 more apprenticeships a year for 18-21 year olds, funded by cutting numbers on low-value university courses which are expensive for taxpayers and don’t help students.
Replace the current sickness and disability benefits - ending PIP claims for lower-level mental health conditions and returning PIP claims for back and joint pain to their 2021 level.
Cut business rates on high street shops, giving business rates relief to 250,000 high street businesses, which have traditionally given young people their first shot at work.
One way or another, something big needs to be done - it’s really bad out there for young people.
The LFS is good enough to show youth inactivity and unemployment are high and rising, but it likely misses the young people with the biggest problems, and its unemployed/inactive/sick breakdown for under-25s rests mostly on parents’ answers. The Resolution Foundation found that only one in seven responses for 16–24s come from young people themselves, rather than proxies or imputed data.
RTI can’t give us unemployment or inactivity rates, because they are just counting the number of employments, not trying to measure the numbers who aren’t working. The advantage of RTI over LFS is that it’s administrative data – so much more granular.
NB OECD data for EU goes back to 2000, Youth is defined as 15-24 years
ONS Annual Population Survey via NOMIS, unemployment rate for 20-24 YOs by region, Eurostat, unemployment rate for 20-24 YO by EU country)
Thank you for this article.
However, the effect you describe could be entirely explained by the increase in enrollment in higher education over the last two decades, which change the composition of the people who are not in education (who probably have now much lower skills and abilities than 20 years ago, since it's a lower share of the youth).
I think this composition effect is unlikely to explain the entire increase in inactivity and employment, but it has certainly a large effect.
You should also have posted percentage inactive / unemployed compared to the total 16-24 years old population, as well as percentage in education. That would have enabled to see the true trend, net of composition effect.
I reckon boris wave migration would have a big impact at the bottom end in London. Anecdotally there’s been a marked increase in people with subcontinental accents in public facing entry level positions these past few years.