

Crime rates are higher in urban areas - that much is well known. But the proportion of crimes that lead to a criminal being charged is much lower in rural and suburban areas - at least outside London. Why is that?
For this piece I have drawn on the open data published by the police which lists outcomes for each recorded crime, together with a geographical location for most of them. It is a huge dataset but - partly for that reason - I have never seen it well visualised.1.
Since May 2023 there are 13.9 million individual crime outcomes published, of which 13.7 million have a geographical location. These crimes are divided up into 35,672 neighbourhoods (LSOAs) across England and Wales2, which contain roughly similar numbers of people. The data is updated over time and tells us what the eventual outcome was for each crime.
Only 9.7% of crimes led to criminals being charged. Another 4.1% got a caution or an equivalent (like a drug warning, or fixed penalty), but that’s still just 13.9% getting either charged or cautioned. Of the rest, the bulk were recorded as
42% “Investigation complete; no suspect identified”, or
40% “Unable to prosecute suspect”
So clear-up rates are disappointing nationally - but there are places where they are particularly low.
Local variations
Here is how the proportion of crimes that led to a suspect being charged varies between different neighbourhoods. There is no data for Greater Manchester because they’ve had IT problems. And I’m going to start by excluding London, as that makes the trends elsewhere clearer.
In the map below, the red areas are the third of neighbourhoods with the lowest charge rates, and the blue areas are the third with the highest charge rate. (White places are the middle third). The blue and red areas contain roughly the same population, but the red area is twice as big - because the red areas with low charge rates are more rural and suburban.
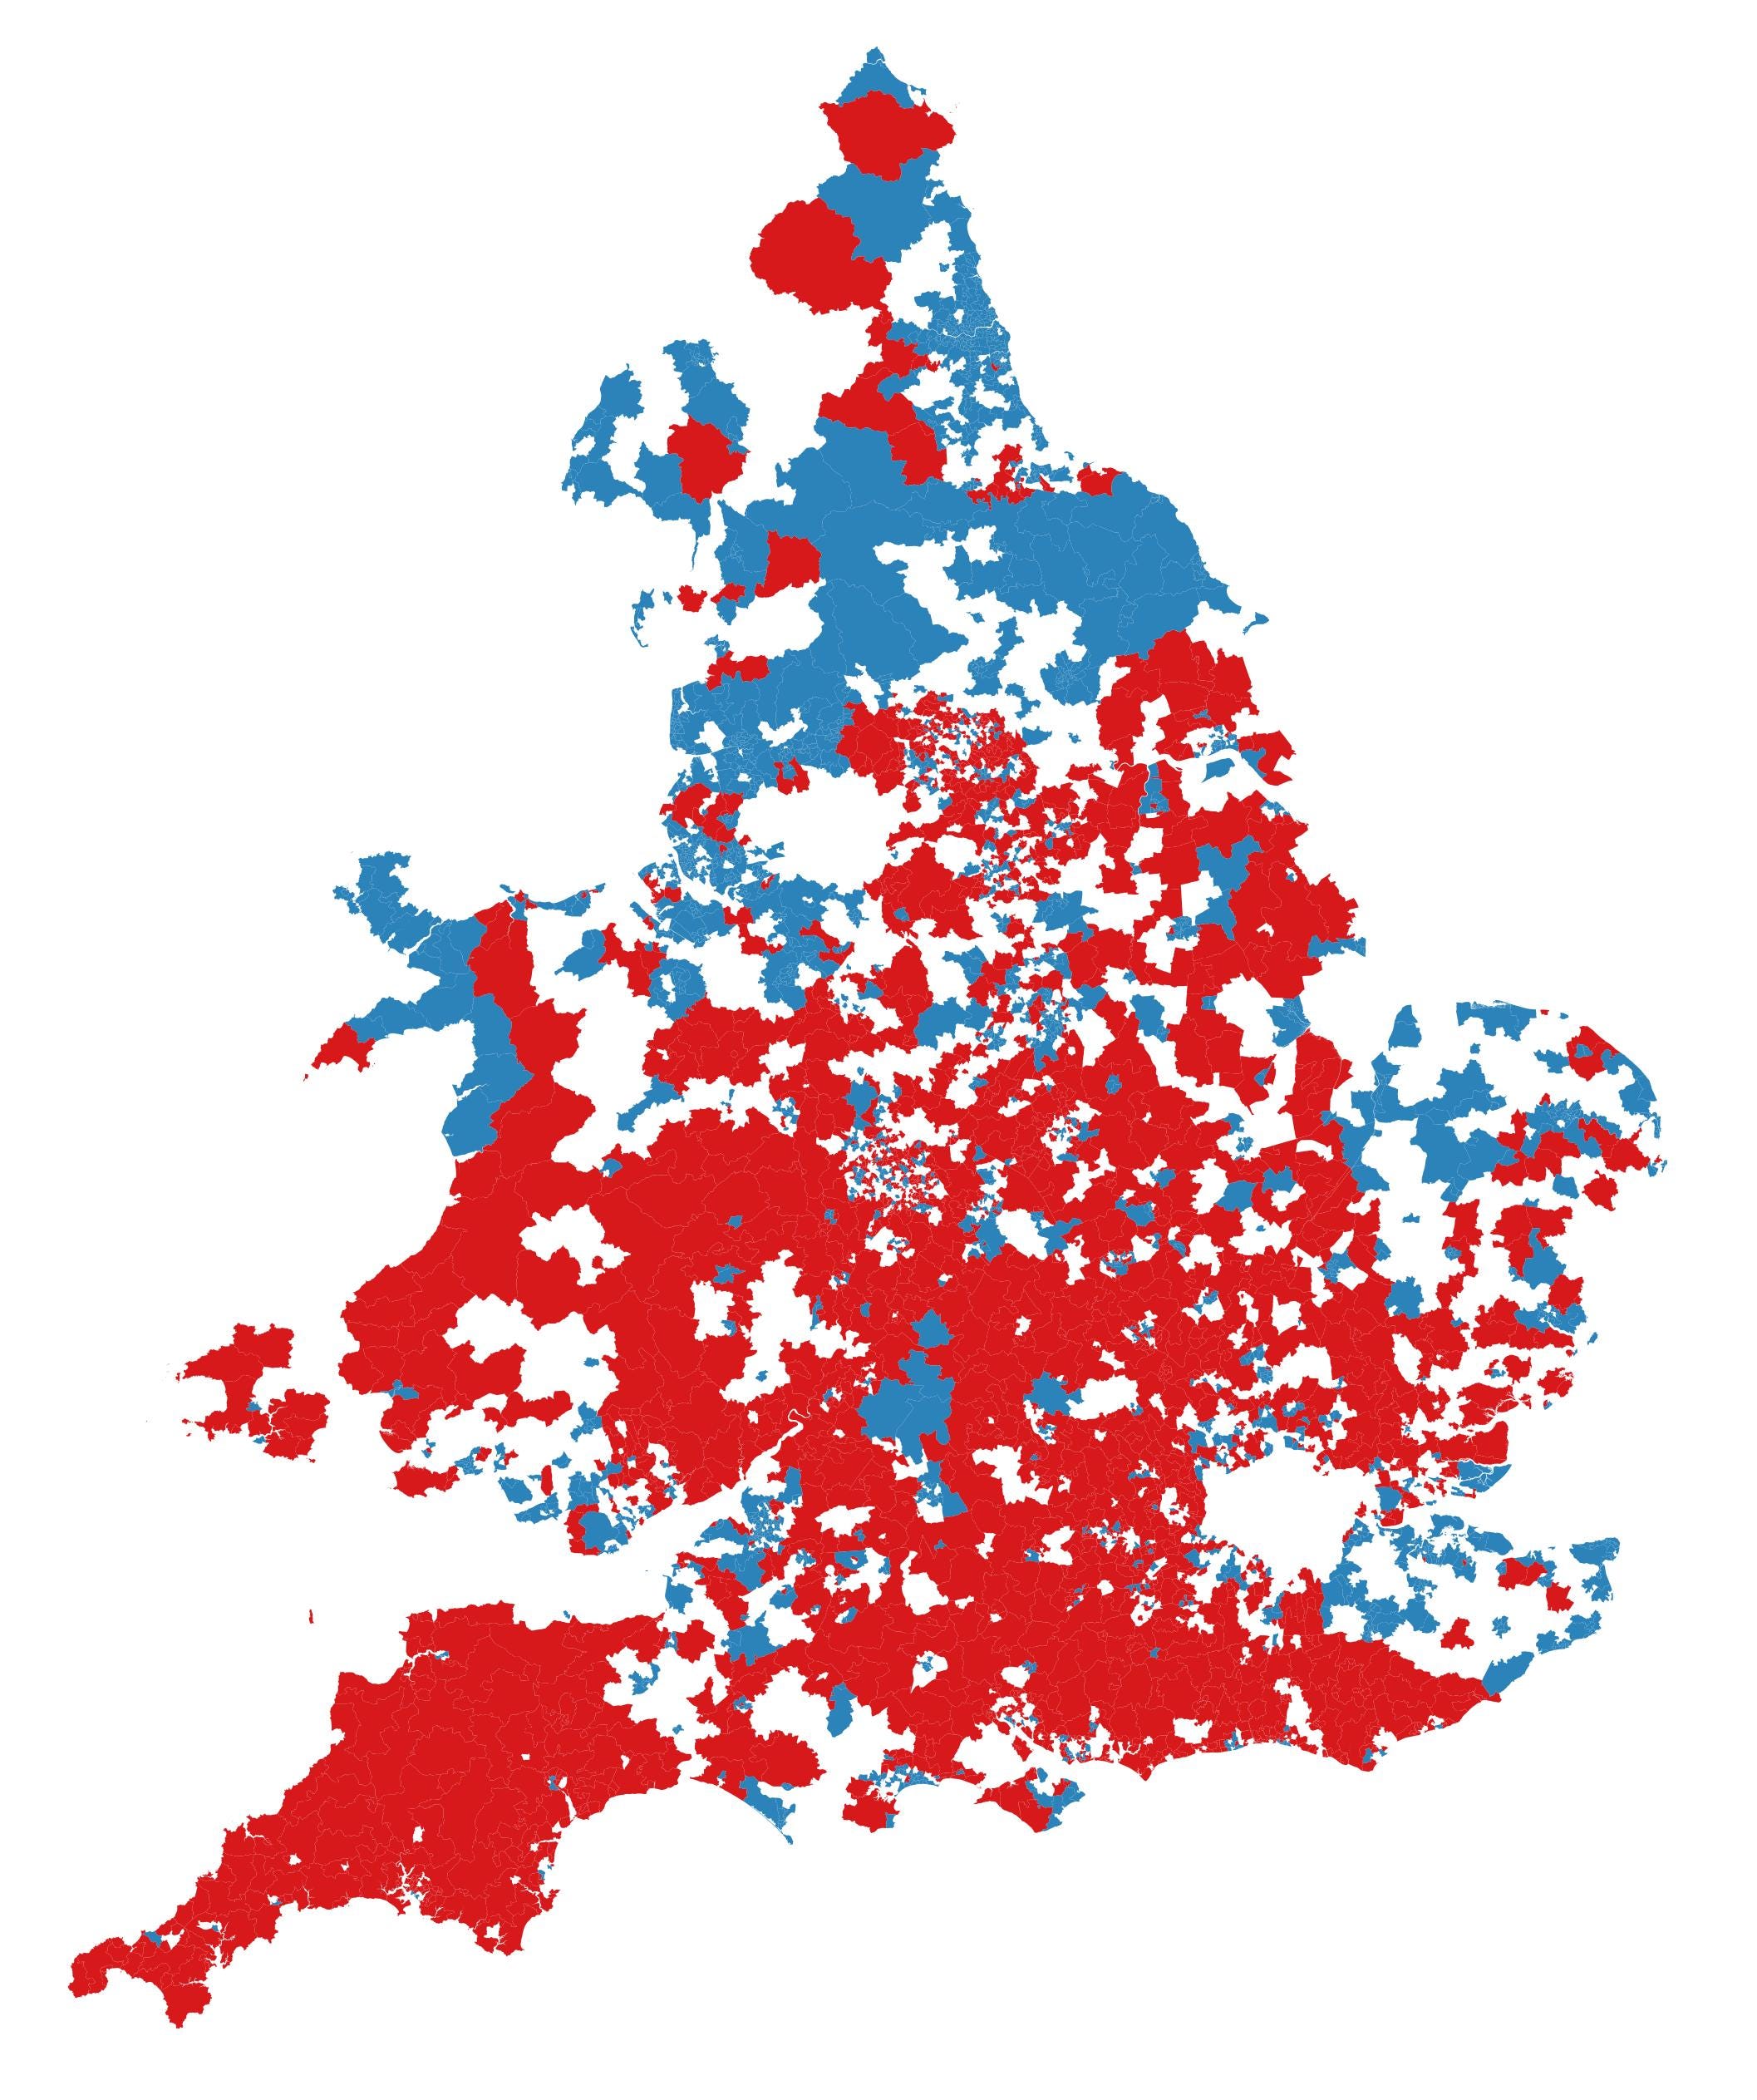
As you can see, the neighbourhood data is quite “noisy” because numbers are small for an individual neighbourhood3. We can get rid of that noise by aggregating the data into police force areas. If we aggregate up to the level of the police force we really lose the urban-rural picture, because most forces are big enough to contain a mix of city, town and country. But by aggregating up we can see even more clearly that some mainly-rural areas are doing much better than others.
Why do so many more crimes lead to a charge in Norfolk (15.9%) compared to neighbouring Cambridgeshire (10.2%)? Why is Dorset (12.6%) doing better than next-door Devon and Cornwall (7.4%), and why are cops in Kent (12.7%) doing better than over the border in Sussex? (7.8%).
Another dimension of variation between forces is in the use of cautions and drug warnings. The variation in approach between different forces is massive. For every ten people Cleveland police charge they give out just one caution. For every ten people Dyfed-Powys Police charge they give out nearly nine cautions. So if we look at the combined charge and caution rates the picture is a bit different - though still with the same unexplained gaps between similar force areas:
Robert Peel was right that “the test of police efficiency is the absence of crime and disorder, and not the visible evidence of police action in dealing with them” - but it is not obvious that the forces that are doing less well at charging criminals are doing better at deterring crime.
The rural urban clear-up gap
Were the urban rural gaps we saw at the neighbourhood level just the result of more rural police forces doing things differently?
No. To look properly at the urban-rural clear-up gap, let’s drop back to the level of the neighbourhood. But rather than just eyeballing the noisy map at the top of this piece let’s do some statistical analysis.
The urban-rural clear-up gap is really big: in the most urban half of areas outside London over 11% of crimes lead to a charge or caution, but in more rural areas the share of crimes leading to a charge drops off a cliff - it’s just 6.9% in the most rural tenth of neighbourhoods.
So on this data nearly two thirds (64.5%) more crimes lead to a charge in the densest tenth than the most rural tenth.
It’s well known that there are more crimes in urban areas, but that doesn’t explain why a greater proportion should be solved.
You might wonder if this is just because the daytime population is different to where people live. We can also use a different measure of population density which ONS publish which measures workday population density4 - how many people live in an area plus how many people work there too. This gives us a different shaped curve but the same trend: far more crimes lead to a charge in urban areas.
If crimes in rural and suburban areas are much less likely to lead to a charge, what is happening with those crimes instead?
For simplicity, let’s just compare the most and least dense 10% by place of residence.
The gap is not in the use of cautions, which are used equally.
The gap is comprised of several things. In the rural areas more cases are likely to end with no suspect identified. But they are also more likely to have a suspect but not enough evidence to prosecute. And also more are handed over to another organisation: like a local authority, educational organisation, or a specialist body like border force, RSCA, DVLA etc5.
But this still doesn’t really tell us much. It is not obvious why it should be harder to prosecute a known suspect in a rural area, or even why it should be harder to identify one. On the one hand there is more public CCTV and the like in urban areas. On the other there is more anonymity in the city: the unfamiliar face or vehicle stands out more in the village than the city centre.
Crime type by area
Let’s try another approach to explaining the rural-urban gap in charge rates. Perhaps the mix of different types of crime can help to explain it?
To look at that we need to turn to another large dataset, this one focussed on crime types. This dataset isn’t designed to be updated over long periods in the same way as the data above, but is more like a snapshot each month - so it is slightly less good in that respect.6
This dataset has 11.2 million crimes and 2.2 million recorded instances of antisocial behaviour in it since the start of 2024. I have excluded the small proportion7 of crimes that are still under investigation.
You can see that some types of crime are much more likely to end up with a criminal in court: weapons offences are much more likely to lead to a charge than robbery. You can also see that there is a big variation in the use of cautions: very few burglars get a caution, but a lot of drug offenders do8.
In general, offences where the offender can often be identified at the point where the crime is detected (weapons offences, shoplifting and drugs) have higher clear-up rates than ones that rely on reports (like bicycle theft, vehicle offences and so on).
So this initially looks like a very promising explanation. Perhaps the gap is just compositional - perhaps urban areas just have more of the crimes with higher solve rates?
But no - even once we break down by crime type we still see the same rural-urban charging gap for pretty much every crime type.
The charts below all exclude London and are ordered from top left to bottom right, from the offence types accounting for the smallest number of crimes to those accounting for the most.
The rural-urban clear-up gap is visible in pretty much all crime types, particularly the larger crime types at the bottom.
On the charts above I have allowed the scales to vary on each graph - otherwise the trends would be invisible for the crime types with lower charge rates overall. But this obscures the fact that the rural-urban gap is much bigger for some crime types than others.
Let’s compare the most and least dense areas for simplicity - in other words the dots at the ends of the lines in the chart above.9
Every crime type is less likely to lead to a charge in more rural areas10. But for some the gap is bigger.
For example, for burglaries, just 3.6% are solved in the least dense tenth. More than twice as many are solved the most dense tenth (8.7%).
Constituencies
All of this talk about “the most dense 10%” and so on may sound a bit abstract. So let’s look at what it means in some real places.
Because for individual crime types the numbers are smaller, we will need to aggregate up a bit more to get meaningful numbers for local clear-up rates by offence.
Different types of crime are mainly pretty correlated, and urban areas have the most crime. The constituency with the largest number of crimes outside London is Birmingham Ladywood - represented by none other than the Home Secretary, Shabana Mahmood.
There are some quirks and variations. You won’t be surprised to learn that Oxford and Cambridge stand out for high rates of bicycle theft. Leafy Sheffield Hallam doesn’t have high crime overall, but does have a lot of burglaries. Crawley has a lot of weapons offences - nearly seven times the national average. And Liverpool seats have a lot of drugs, particularly Liverpool Riverside which recorded just under 10,000 dugs offences - that’s over 15 times the national average.
Here is the proportion of burglaries that lead to a burglar being sent to court or charged by constituency. You can see the cities stand out as darker dots, meaning much higher shares of burglars being charged.
The differences are really big, even within force areas and between neighbouring seats. In urban Leicester South 15% get cleared up. In suburban South Leicestershire it’s just 4%. In Cambridge 14% get cleared up. But in Mid Cambridgeshire just 4%. In Ipswich 13%, but in South Suffolk just 3%. In Carlisle 19%, but in neighbouring Hexham just 3%. And so on and on.
And the same is true if we look at all crimes - the charge rate is higher for Northampton than Northamptonshire, for Lincoln than Lincolnshire, for Oxford than Oxfordshire, Telford than Shropshire, and so on.
I don’t have space here to cycle through all the crime types - doing so would show that forces do either record or tackle some crimes differently. Norfolk prosecutes drug offences at a very high rate (30-40%) and Kent prosecutes a lot of public order offences - about twice the national average. So, again what individual police forces do absolutely matters - but that comes on top of an urban-rural clear-up gap that exists across most of the country.
Other trends
Because all this data is geolocated we can compare it to any other neighbourhood data we want. For example, using census data, we can see that charge rates are higher in areas with fewer people born in the UK, and higher in places where more people have never worked: given the urban-rural split this is not really surprising.
The exception: London
London has high crime rates and low charge rates, and is large enough to dominate the picture at the top end. So if we were to redraw the charts above to include London we get a more complicated shape - lower charge rates in rural areas, but also low charge rates in very densest areas (which London dominates because it is so much denser than anywhere else).
We can look inside London too, but I’m not sure what if any conclusions to draw from doing so. The overall number of crimes is highly concentrated in the very centre of the city. But even so, compared to the rest of the country the crime rate is high and the charge rate is low everywhere across the city.
I have used a different colour scale here to highlight the fact that that we are on a much lower scale in London. I’m not sure what if anything we can learn from the pattern of charge rates overall. and if you look by different crime types the pattern of charge rates seems to vary for every type of crime.
One thing you can say is that because charge rates are so low, for some crime types we see very few convictions. Less than 4% of crimes lead to a charge in places like Croydon South or Hampstead.
Across 14 |parliamentary seats in London11 there were 1,710 bicycle thefts - of which exactly zero led to someone being charged, at least in this dataset. In fact across the capital as a whole, 349 out of 32,907 bicycle thefts led to a charge or court appearance.
Conclusions
It is not obvious why, outside London, charge rates should be so much lower in rural and suburban areas than urban areas. It is not just a compositional effect - and not just to do with daytime populations.
The urban-rural clear-up gap seems to affect all crime types to a greater or lesser extent, but it is not an iron law either - some forces are doing better in rural areas than others. And London seems to be a proper exception - an urban area with very low charge rates.
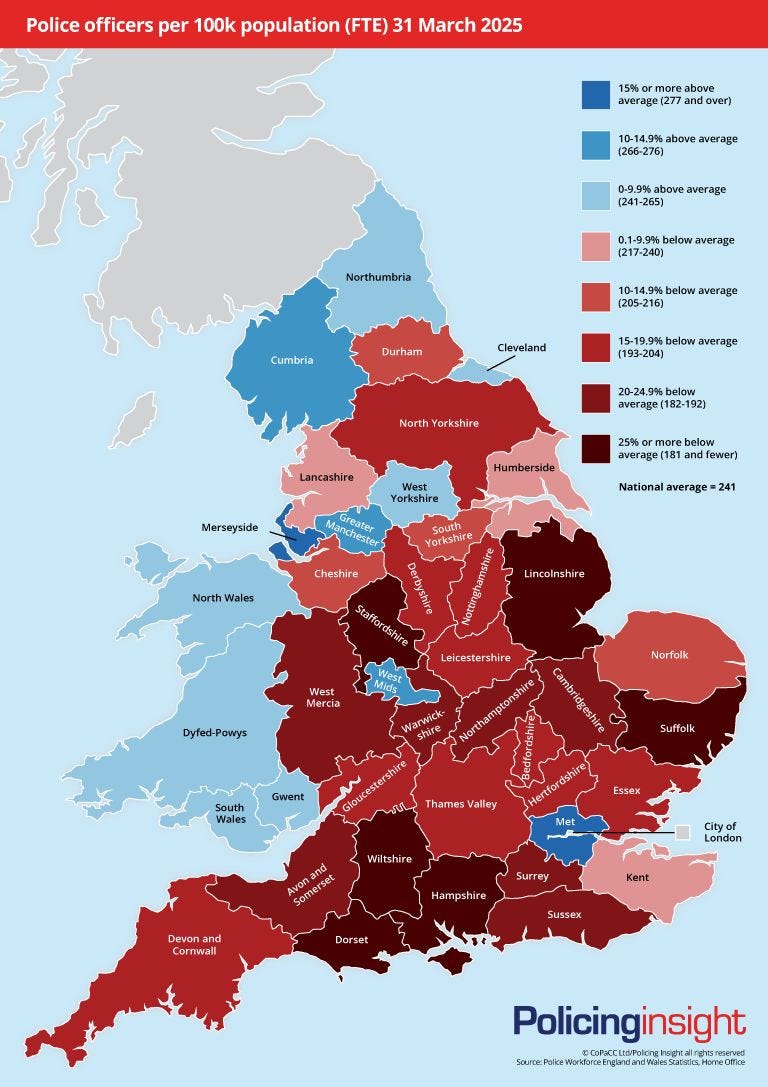
The number of police officers per head is higher in urban areas where there is more crime - London and Merseyside have the most per head, Lincolnshire the fewest. But even then there is variation between similar places. Though there is a debate to be had about how many cops each area should have, given different crime rates, the data above makes the case that more police are particularly needed in less urban areas.
As well as overall force resource levels, other explanations might be:
Resource allocations within forces. There are often worries in rural areas that the police leadership and police resources are too focussed on the urban areas where crime is higher. It is quite hard to get a handle on where within their area each police force is actually deploying officers, but one reason for the gap may be that relative to crime rates more officers are deployed in urban areas.
Leadership and approach. Different police leaders have quite different approaches: some emphasise the need to investigate all crimes more strongly, some require that certain basic “checklist” things all happen. There are quite different approaches to cautioning vs charging in different places. Police leadership and policy may be driving part of the gap.
What to do about it
While there is no magic bullet explanation for the rural-urban clear-up gap, the need to solve it is clear. Some forces are doing better - so it can be done. And if rural areas could just get to the same clear-up rates urban ones already have then we would be solving an extra 5% of all crimes every year.
The Conservative Policing Plan would help increase charge rates across the board.
The per capita allocation of our proposed 10,000 extra police would particularly help less urban areas - because it would level up rural forces proportionately more and reduce those gaps in the map above.
Chris Philp’s plans to cut police bureaucracy and make sure police always do the basics in every investigation would help too.
Residents of the more suburban and rural parts of Britain certainly deserve better policing.
The police do also provide some basic crime maps, but they are short snapshots and don’t make it easy to compare areas.
Data for Greater Manchester is missing - they had major problems with police data during the period.
In the red blue map I have already aggregated up to the MSOA to reduce the “noise” a bit.
This measure is from the Census 2021, so is a bit older than the residential population data, which is for midyear 2024.
The last little bit of the gap is in more “Further investigation is not in the public interest” - which is supposed to be for minor issues.
That snapshot nature of it may be one reason why the eventual outcome data above has a slightly greater proportion of crimes leading to a charge or caution.
About half a percent.
Cautioned here includes the headings: “Offender given a caution”, “Offender given a drugs possession warning”, “Local resolution”, and “Offender given penalty notice”.
The picture would be slightly different for some if we compared the least dense to the middle.
Obviously, you can see that for some of the smaller crime types (like bicycle theft) the pattern is a bit more hump shaped. But clear-up rates are always lowest for the most rural areas.
Croydon South Old Bexley and Sidcup Ruislip, Northwood and Pinner Chipping Barnet Croydon East Chingford and Woodford Green Ilford North Beckenham and Penge Sutton and Cheam Ealing North Enfield North Barking Hendon Lewisham West and East Dulwich
Perhaps we could swap officers between rural and urban areas and capture the issues leading to worse outcomes and solutions for them. I suspect budgets are the main issue, but possibly not the only issue.
One reason is less police as the force uses them in the crime focused areas. As leader of a rural council we knew there were only 6 police on duty across 50,000 people and they would all be in the military town on a Friday and Saturday night.