Legal migration policy: the wrong direction
Changes put in place by Boris Johnson both massively increased overall numbers, and took us further away from being the 'grammar school of the west'
Today all the focus will be on illegal immigration. It’s hugely important, but legal migration is much, much bigger.
In recent years migration to the UK has been unprecedentedly high. This is the exact opposite of what voters have been promised in every election since 1992.
While a small part of this the result of (rightly) offering humanitarian protection to those from Ukraine and Hong Kong, those two routes are a small part of the story: just 226,000 out of net non-EU migration of 2,008,000 in the last five years, or 11%.
Instead, much of the increase is the result of deliberate policy choices taken under Boris Johnson, and not repealed since.
In a previous post I argued we should reduce migration and make it more selective, to make Britain the grammar school of the western world.
As numbers have growth, have we at least been getting more selective so that the upsides are bigger and downsides smaller? Sadly the reverse appears to be the case.
From Europe to the rest of the world
We can see Britain has swung from having migration mainly from the EU, to migration mainly from the rest of the world.
Net migration from the EU turned negative in recent years, so over the last five years to June 2023, net migration from the EU was just 45,000, compared to 2,008,000 from the rest of the world.
This has likely made the mix worse from an economic point of view. Every single one of the studies listed by the Oxford Migration Observatory finds that non-EU (or rather EEA) migration has been a net fiscal negative: people from outside the EU consumed more in public services than they contributed in tax, and that’s before we even get to the economic impacts on housing, infrastructure, etc.
Some of those studies are more positive about non-EU migration during in the 2000s (though others are not). However, for reasons I will get into, I think more recent migration has turned in an more economically negative direction.
The ONS produces data on net tax paid and public services received. Unfortunately, it doesn’t produce estimates by nationality.
However, it does produce estimates by ethnicity, and although ethnicity and migration are definitely not the same thing, they do point in the same direction as the studies cited above.
Many of the people included in the groups below are British, and born in the UK, and better placed to earn more than their migrant parents or grandparents. Given they contain that positive effect as well as the impact of first generation migrants, these figures do add weight to the case that, over the long term, the effect of non-EU migration has likely been a fiscal net negative.
People from poorer countries are more likely to be net recipients and less likely to be net contributors
This net fiscal effect of any group is a combination of multiple factors: employment rates, hours worked, wage rates, age, family structures and so on.
Obviously it would be helpful to know what salaries people are coming to. The government collects this data, but does not publish it. I asked a PQ on this recently and was told that “The Home Office does not publish the information on the salary of work routes, however a Regulatory Impact Assessment will be developed in due course.” This is very poor, and makes sensible policy making harder.
Places like the Netherlands, Germany and Denmark all produce sophisticated analysis of fiscal impact by route, nationality and age. The UK is miles behind. Although we have the data, it is not being linked or used.
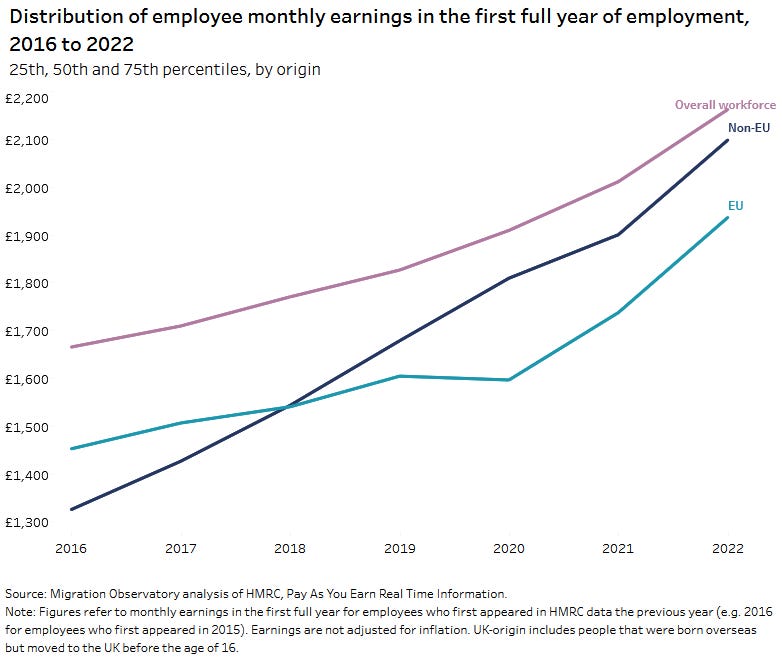
HMRC recently started publishing some data on earnings - median earnings for people in the first year they appear in the data are shown below. But we can’t see from this data many people in each group are not working or leaving the country, and there is no breakdown by country or visa route. There is also a serious problem to do with attrition, which makes comparisons after the first year of work hard. So it doesn’t really help us make policy.
Source: Migration Observatory, analysis of HMRC data.
We can look at other data that will shape the economic effect of migration.
For example, Census 2021 found 67% of those born outside the EU aged 20-64 were in work, compared to 75% of those born in the UK. Within this there was huge diversity, with rates very low for those coming from the middle east, Bangladesh (51%), Somalia (52%) and Pakistan (54%), and very high rates for EU member states (82%), Australia (85%) and New Zealand top at 86%. Generally, people from richer countries are more likely to be in work.
People from richer countries are also much more likely to earn more when they are in work. Unlike other countries, the UK doesn’t produce an official breakdown of migrants net fiscal effect. HMRC does produce analysis of just two taxes (income tax and NICs) and two benefits (tax credits and child benefit). This is a small sliver of tax and a very small sliver of public spending.
In 2019/20 total receipts were about £830bn of which a bit over £190bn was income tax and about £60m from the employee part of NICs. (so about 30% of receipts). In the same year total spending was £888bn of which about £18bn was on the (legacy) tax credit system and £11.5bn on child benefit (so about 3% spending).
Amazingly, even on this basis, the analysis suggests that a number of nationalities were net recipients, not net contributors across these four taxes and benefits, including nationals of Somalia, Afghanistan and Bangladesh.
But the analysis doesn’t even purport to be an overall picture, and in the absence of any proper analysis by government, its main usefulness to compare relative personal tax contributions.
The data needs taking with a big pinch of salt. Because the census doesn’t ask directly about nationality we have to use ONS population estimates. In some cases these estimates look much too low: for a number of countries the population estimate is actually lower than the number of NICs taxpayers HMRC recorded, suggesting the ONS population estimate was too low for countries like Romania, Bulgaria, India, Nigeria, Nepal, the Philippines, Jamaica and Kenya, which will make the average tax paid per head look higher.
But the general pattern is clear, and not surprising. Both in Europe and the rest of the world, people from richer countries generally paid much more tax.
Western Europe and countries like the USA, Canada and Australia head the table of top taxpayers.
Income tax and NICs paid per head were about two thirds higher in the EEA & Switzerland than non-EEA, so the swing away from Europe will likely mean fewer net contributors - unless it was a swing towards rich countries outside Europe.
Unfortunately, that isn’t the case.
Sources: ONS, Population by birth and nationality, 2019-2020 and HMRC, Income Tax, National Insurance Contributions, Tax Credits and Child Benefit Statistics for Non-UK Nationals: 2019 to 2020
Non-EU migration has swung away from rich countries and towards much poorer countries
Home Office visa data gives a much richer picture of how migration to the UK is changing than the ‘headline’ net migration figures.
Before Brexit in 2020 people from the EU didn’t generally need visas to come to the UK to work or study. So visa data is best used to compare how trends have changed within non-EU migration.
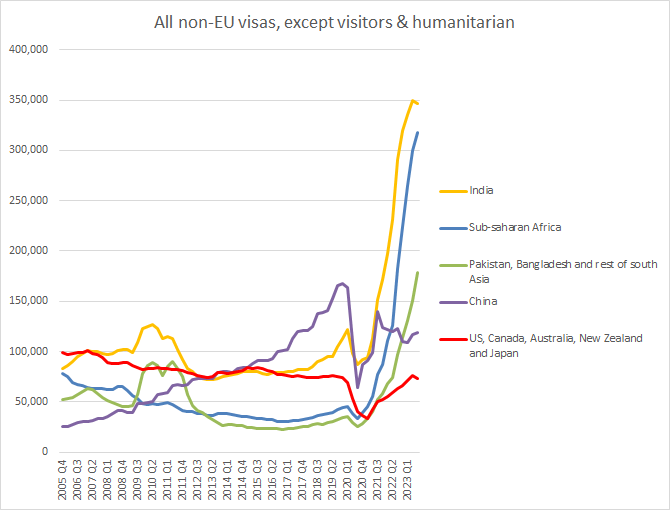
If we look at visas for work, study and family together (so excluding visitor visas and the humanitarian routes) we can see that within net migration there has been a swing towards much poorer countries and away from developed countries like the US, Canada, Japan, Australia and New Zealand.
Numbers are down from these countries, despite a rising number overall, so the share of visas going to people from these countries with non-EU migration has been declining sharply since 2015/16.
The biggest growth has come from sub-Saharan Africa. Of this, the great majority is from Nigeria (about 70% of the growth) with a bit from Ghana and Zimbabwe (the other 30%). There has also been a big increase from India and the rest of south Asia, (mainly Pakistan and Bangladesh) while the proportion from China is down.
Shares:
Absolute numbers:
(Source for these and all charts below: Home Office, data tables, Vis_D02)
Put together the decline in numbers coming from Europe, together with the shift towards poorer countries within that non-EU migration, and you have a huge shift towards poorer countries overall. What is driving it?
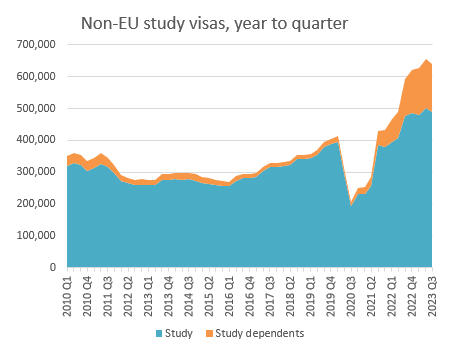
To understand what is driving the overall changes within non-EU migration, we can look at the different routes. Study and work are the big ones, and the family route is smaller.
Net migration, five years to June 2023
Total non-EU: 2,008,000
Work: 309,000
Work dependents: 269,000
Students: 450,000
Student dependents: 133,000
Family: 230,000
How student visas have changed
One big part of the change is driven by student migration.
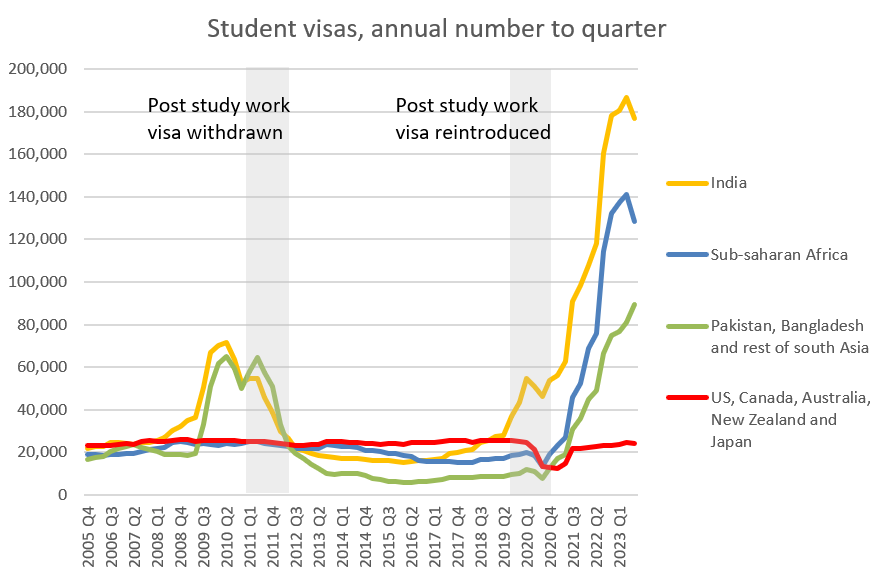
The coalition government ended the ability to study and then stay on to work (announced 2011, in effect 2012).
But Boris Johnson’s government reintroduced this “post study work visa” (announced 2019, starting 2020).
The government’s press release hailed this as a move to attract the “best and brightest.”
In practice this reform has made absolutely no difference to the number of the ‘best and brightest’ who came from rich countries, but a huge difference to those from poorer countries.
There are two reasons for this. Student visa holders are able to work at any skill level (or not work) and don’t need a job offer in advance, or to earn any minimum salary. Effectively this allows them to bypass even such limited restrictions as there are for the work route.
It effectively punches a huge hole in attempts to make economic migration selective.
Unlike for people from richer countries, from people from poorer countries it represents an opportunity to earn much more than they could at home.
Absolute numbers (minus China for simplicity):
The work/study visa was something which was regarded as an abuse in 2011, which we managed to agree with the Lib Dems we should abolish, and despite that… it was brought back again under Johnson, with a massive impact in terms of increasing migration into low wage work.
The government recently said it will “review” the two year work option. I think we need to move faster. Nick Clegg and David Cameron got it right first time.
The other big story in study visas is the rise and then decline in the number of students from China, with the share of students from China rising and then falling off post-pandemic. There are a mix of things going on: pandemic disruption, global decoupling and politics, the rise of China’s own universities and so on. The same thing seems to have happened to Chinese students in the US, with more opting to stay home.
Shares:
Within the growing total a larger proportion of students brought dependents with them, leading government to restrict this right for students starting next September. Students from poorer countries are much more likely to bring dependents. Since 2021 42,000 American students got visas and brought 2,000 dependents. 327,000 Chinese students brought 1,600 dependents. In contrast, 120,000 Nigerian students brought 123,000 dependents.
Work - making it easier to come from outside the EU
When it comes to work visas the post-Brexit migration system installed by Boris Johnson again represented a tightening up of the rules for arrivals from the EU, but a significant liberalisation for the rest of the world (which is much obviously much bigger!)
Until the end of 2020, non-EU citizens on an ordinary work visa would usually need a salary of at least £30,000 in a graduate job; but the new system allowed a wider range of middle-skilled occupations to qualify, with the minimum salary required set at £25,600 as standard and as low as £20,960 for some workers. It has also:
abolished the annual cap of non-EU workers arriving in the UK (set at just under 21,000);
opened overseas recruitment to lower skill levels (RQF 3-5);
opened still lower levels (RQF 1-2) to care workers;
removed the Resident Labour Market Test (the requirement that jobs should first be advertised on the home market)
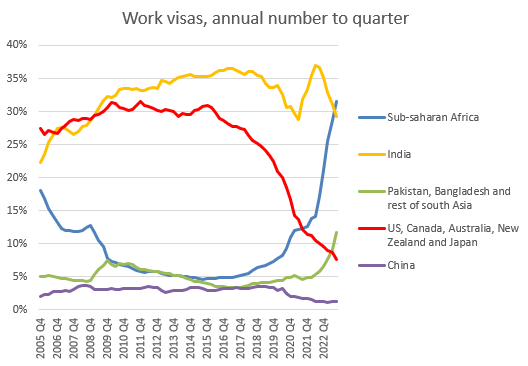
Again, the result was a shift in the balance from richer country migration towards poorer countries. In absolute terms numbers coming from richer countries had been trending gently down since the mid noughties. Since numbers from poorer countries have hugely increased under the new system, the share from richer countries has plummeted.
Shares:
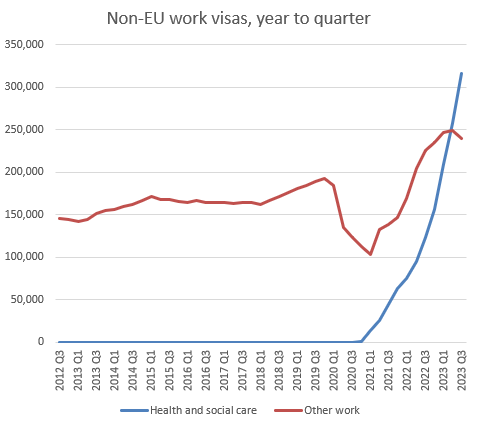
Absolute numbers:
Much of the change in the work route is driven by the explosive growth in the health and social care visa, but other work routes have also gone up.
I wrote before about why the social care visa is a piece of Treasury short termism, saving a little by depressing already-low wages now, at the cost of bringing in people on minimum wage jobs who are mainly going to be net recipients, not net taxpayers in the longer term.
The people coming are kind, and many are exploited.
But for existing citizens this is ultimately a PFI-style, pay-less-now, pay-much-more-later kind of arrangement, and compared to paying people in social care a bit more, it also has bad effects on the care of the vulnerable.
The government has set out plans to reform work routes to some extent.
People on the care worker visa will not be able to bring dependents (there were 120,000 in the year to September 2023) and CQC registration will be required, which the government thinks would have stopped 23,000 people coming in the year to September.
Looking at the other work routes, the government also said it would increase the ‘headline’ salary threshold to £38,700 and reform the Shortage Occupation List.
But because other routes allow people to come at rates far below the headline rate, the government estimates this would only have reduced numbers coming by 14,000 in the last year. This is in the context of 219,000 coming on the work route in the year to June. (169,000 non-EU, 50,000 EU).
Conclusion
The reforms put in place under Boris Johnson were the opposite of what people who had supported him wanted. They have massively increased overall numbers, and likely made the economic effect less positive and more negative.
Ukraine and Hong Kong are a small part of the story. Despite the rhetoric of a ‘points based system’, the reality is that we have been moving away from being the grammar school of the west.
Policy making is hampered because government doesn’t collect the data or produce the analysis of net contributions that other countries do.
So we can see that more people are coming from relatively poor places as a result of liberalisation of the rules. We can see that in general people from poorer countries tend to earn less in the UK, making them more likely to be net recipients rather than net taxpayers. We can see how student work visas have blown a hole in the system. We can see the explosive growth of the social care visa, with people coming for minimum wage jobs.
On top of other factors like the impact of such rapid migration on housing and infrastructure, this is likely to make the overall economic impact less positive.
Sadly, unlike other countries, the UK does not have proper linked data that would allow us to analyse the net contribution or receipts of migrants by country or migration route. Better data would help shape better policy, so we should fix this urgently.






This is excellent.
There is more information on the cost of immigration in this article on my own, British Patriot, substack blog: https://britishpatriot.substack.com/p/immigration-the-good-the-bad-and
Do come and have a look!